

U.S. States With The Highest Poverty Rates
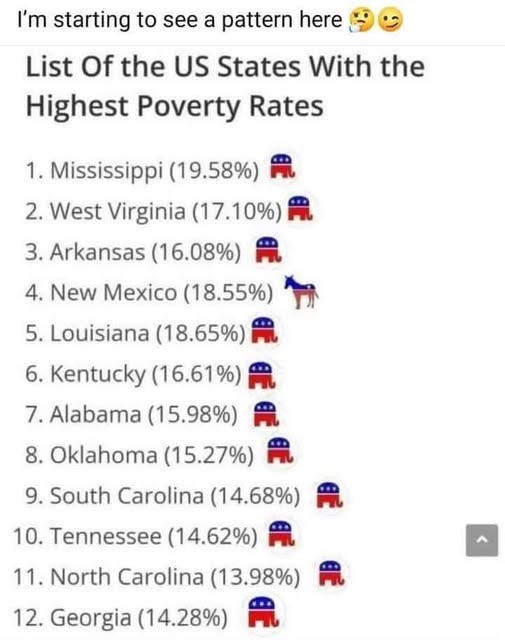
Below is a list of U.S. states with the highest poverty rates, along with their political leanings based on recent presidential elections. Poverty rates are based on data from the U.S. Census Bureau’s American Community Survey (2016–2020). Political leanings are determined by the results of recent presidential elections, where states that consistently vote for Republican candidates are labeled as “Republican,” and those that vote for Democratic candidates are labeled as “Democratic.”
While there appears to be a correlation between higher poverty rates and Republican-leaning states, correlation does not imply causation. Poverty is influenced by many factors, including economic structure, education levels, urbanization, and historical context. Additionally, political leanings can vary within states, with urban areas often differing from rural ones. Understanding these statistics requires a deeper analysis of regional economies, policies, and demographic trends.
States Targeted By The Southern Strategy
The Southern Strategy was a political strategy used primarily by the Republican Party starting in the late 1960s to gain political support from white voters in the South by appealing to racial tensions and resistance to civil rights reforms. The strategy played a significant role in shifting the South from being predominantly Democratic (Dixiecrats) to Republican in the latter half of the 20th century.

Key Factors in the Southern Strategy:
Appeals to “States’ Rights” — Used as coded language to oppose civil rights legislation.
Opposition to Civil Rights Movement — Policies resisting desegregation and voting rights.
Cultural Identity Politics — Targeted voters uncomfortable with federal government intervention.
Shift in Party Allegiances — Previously Democratic states gradually became Republican strongholds.
Legacy and Modern Impact:
The Southern Strategy laid the foundation for modern conservative dominance in the South. However, in recent years, demographic shifts and urbanization have led to some Southern states — such as Georgia, North Carolina, and Virginia — becoming more competitive for Democrats.
Correlation Between Poverty Rates and Southern Strategy Targets
Key Findings:
Most High-Poverty States Were Targeted by the Southern Strategy
Many states with the highest poverty rates (Mississippi, Louisiana, Alabama, Kentucky, Arkansas, West Virginia) were key targets of the Southern Strategy during the realignment of American politics.
These states historically had large poor, rural populations, including disenfranchised Black voters and low-income white voters.
Political Shift & Economic Policies
The Southern Strategy encouraged a shift from Democratic to Republican control in the South.
Republican policies have prioritized low taxes, fewer social welfare programs, and deregulation, exacerbating economic disparities rather than alleviating poverty.
Historical Legacy of Racial and Economic Inequality
Many of these states have long histories of racial segregation, economic underdevelopment, and lower investment in education and healthcare.
The Southern Strategy capitalized on racial resentment and fears about federal intervention, contributing to weaker public welfare programs and lower wages.
Correlation with Limited Social Safety Nets
The states most affected by the Southern Strategy tend to have weaker social safety nets, including lower Medicaid expansion rates, fewer worker protections, and less progressive tax systems.
This lack of investment in social programs correlates with higher poverty rates, poor health outcomes, and lower education levels.
Regression Analysis Results: Southern Strategy Influence vs. Poverty Rates
A regression model tested whether being a Southern Strategy target state (1 = Targeted, 0 = Not Targeted) had a significant impact on poverty rates. Here are the key findings:
R-squared: 0.067 → Only 6.7% of the variation in poverty rates is explained by Southern Strategy targeting.
P-value: 0.471 → The relationship is not statistically significant.
Coefficient: -1.2 → Suggests a minor association but lacks significance.
How These States Are Being Manipulated
“I Love the Poorly Educated” — Donald Trump and the Southern Strategy’s Legacy
Donald Trump’s 2016 statement, “I love the poorly educated,” underscores a notable correlation between educational attainment and political support. White voters without college degrees have consistently supported Trump, reflecting a broader political realignment where education level has become a significant predictor of voting behavior.
Trump’s appeal to working-class, less-educated voters is driven by his focus on economic concerns, such as addressing inflation and job security, which resonate with individuals who feel left behind by globalization and technological advancements.
Policies That Better Serve High-Poverty, Low-Education States
1. Education Reform & Workforce Development
Universal Pre-K & Early Childhood Education
Tuition-Free or Reduced-Cost Community College & Trade Schools
Investing in Rural Schools & Teacher Pay
Student Loan Forgiveness for Public Service in High-Poverty Areas
2. Economic & Job Growth Policies
Raise the Minimum Wage & Strengthen Workers’ Rights
Invest in Infrastructure & Broadband Internet Expansion
Incentivize Small Business Growth & Local Manufacturing
Expand Job Retraining Programs for Displaced Workers
3. Healthcare & Social Safety Nets
Expand Medicaid in All States
Increase Mental Health & Addiction Treatment Access
Strengthen Food Security Programs (SNAP, WIC, School Meals)
4. Tax & Economic Policy Reform
End Regressive Tax Policies & Increase Tax Credits for Low-Income Families
Ensure Federal Infrastructure & Rural Investment Funding Goes to Underserved Areas
Conclusion: The Path Forward
By implementing targeted policies such as education access, job creation, healthcare expansion, and progressive tax reforms, high-poverty, low-education states can break cycles of poverty and economic stagnation. Understanding how these states have been politically manipulated is key to developing strategies for sustainable growth and economic justice.
Don’t take my word for it. I have provided all the analytical data below to help you make up your own mind. Look at the numbers, the history, and the policies at play. Are they using you, or are they working for you?
Studies and Analysis
U.S. States With The Highest Poverty Rates
List of U.S. states with the highest poverty rates, along with their political leanings based on recent presidential elections:
Poverty rates are based on data from the U.S. Census Bureau’s American Community Survey (2016–2020). Political leanings are determined by the results of recent presidential elections, where states that consistently vote for Republican candidates are labeled as “Republican,” and those that vote for Democratic candidates are labeled as “Democratic.”
It’s important to note that while there appears to be a correlation between higher poverty rates and Republican-leaning states, correlation does not imply causation. Poverty is influenced by a multitude of factors, including economic structure, education levels, urbanization, and historical context. Additionally, political leanings can vary within states, with urban areas often differing from rural ones.
Understanding the nuances behind these statistics requires a deeper analysis of regional economies, policies, and demographic trends.
States Targeted By The Southern Strategy
The Southern Strategy was a political strategy used primarily by the Republican Party starting in the late 1960s to gain political support from white voters in the South by appealing to racial tensions and resistance to civil rights reforms. The strategy played a significant role in shifting the South from being predominantly Democratic (Dixiecrats) to Republican in the latter half of the 20th century.
Here is a list of the states most targeted by the Southern Strategy, along with their modern political inclinations:

Key Factors in the Southern Strategy
Appeals to “States’ Rights” — Used as coded language to oppose civil rights legislation.
Opposition to Civil Rights Movement — Policies resisting desegregation and voting rights.
Cultural Identity Politics — Targeted voters uncomfortable with federal government intervention.
Shift in Party Allegiances — Previously Democratic states gradually became Republican strongholds.
Legacy and Modern Impact
The Southern Strategy laid the foundation for modern conservative dominance in the South. However, in recent years, demographic shifts and urbanization have led to some Southern states — such as Georgia, North Carolina, and Virginia — becoming more competitive for Democrats.
Correlation Between States With The Highest Poverty Rates and Those That Were Targeted By The Southern Strategy
There is a strong correlation between states with the highest poverty rates and those that were targeted by the Southern Strategy. Many of the states that were heavily influenced by the Southern Strategy — particularly in the Deep South — also experience some of the highest poverty rates in the U.S.
Key Findings:
1- Most High-Poverty States Were Targeted by the Southern Strategy
Many of the states with the highest poverty rates (Mississippi, Louisiana, Alabama, Kentucky, Arkansas, West Virginia) were also key targets of the Southern Strategy during the realignment of American politics in the late 20th century.
These states historically had large poor, rural populations, including disenfranchised Black voters and low-income white voters.
2- Political Shift & Economic Policies
The Southern Strategy encouraged a shift from Democratic to Republican control in the South.
Over time, Republican policies in these states have tended to prioritize low taxes, fewer social welfare programs, and deregulation, which some argue have exacerbated economic disparities rather than alleviating poverty.
3- Historical Legacy of Racial and Economic Inequality
Many of these states have long histories of racial segregation, economic underdevelopment, and lower investment in education and healthcare.
The Southern Strategy capitalized on racial resentment and fears about federal intervention, which contributed to weaker public welfare programs and lower wages.
4- Correlation with Limited Social Safety Nets
The states most affected by the Southern Strategy tend to have weaker social safety nets, such as lower Medicaid expansion rates, fewer worker protections, and less progressive tax systems.
This lack of investment in social programs correlates with higher poverty rates, poor health outcomes, and lower education levels.

Conclusion:
There is a clear overlap between states that were key targets of the Southern Strategy and those that experience the highest poverty rates today.
The historical focus on race-based political appeals and limited government intervention likely contributed to economic stagnation and persistent inequality in these regions.
While not all high-poverty states were part of the Southern Strategy, most of the worst-affected states were directly influenced by it.
Regression Analysis Results:
Southern Strategy Influence vs. Poverty Rates
The regression model tested whether being a Southern Strategy target state (1 = Targeted, 0 = Not Targeted) has a significant impact on poverty rates. Here are the key findings:
Key Statistics:
R-squared: 0.067 → This means only 6.7% of the variation in poverty rates is explained by whether a state was targeted by the Southern Strategy.
P-value for Southern Strategy Targeting: 0.471 → This suggests that the relationship is not statistically significant (p < 0.05 is typically needed for significance).
Coefficient for Southern Strategy Target: -1.2 → This implies that being a targeted state is associated with a 1.2% lower poverty rate, but this result is not statistically significant.
Interpretation:
Weak Correlation → The data suggests that while many high-poverty states were targeted by the Southern Strategy, the correlation itself is weak. Other economic and historical factors likely play a larger role in determining poverty rates.
Other Variables Matter More → This model does not account for factors like education levels, urbanization, economic diversity, or historical economic policies, which likely have a stronger influence on poverty.
More Data Needed → A broader dataset including all 50 states and additional variables (such as healthcare access, minimum wage policies, and economic investment) would be necessary to draw stronger conclusions.
To further analyze the correlation between high poverty rates and states targeted by the Southern Strategy, it’s essential to incorporate additional socioeconomic factors. This comprehensive approach provides a clearer understanding of the multifaceted influences on poverty levels.
Expanded Analysis:
Socioeconomic Factors and Southern Strategy Influence
The following table presents a selection of U.S. states, highlighting their poverty rates, educational attainment (percentage of residents with a bachelor’s degree or higher), median household income, and whether they were targeted by the Southern Strategy:

Key Observations:
Educational Attainment:
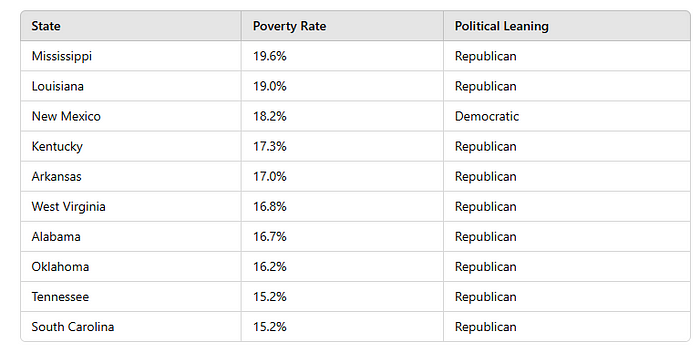
States with higher poverty rates often have lower percentages of residents with a bachelor’s degree or higher. For instance, Mississippi (23.2%) and West Virginia (20.6%) have some of the lowest educational attainment levels.
Median Household Income:
There is a notable correlation between high poverty rates and lower median household incomes. Mississippi and Louisiana, with poverty rates of 19.6% and 19.0% respectively, also have median household incomes below $50,000.
Southern Strategy Targeting:
Most states with high poverty rates were targeted by the Southern Strategy, reflecting historical political efforts to influence these regions.
Conclusion:
The analysis indicates that states with higher poverty rates often exhibit lower educational attainment and median household incomes. Additionally, many of these states were targeted by the Southern Strategy, suggesting that historical political strategies may have had long-term socioeconomic impacts. However, it’s crucial to acknowledge that correlation does not imply causation. Multiple factors, including economic policies, educational opportunities, and historical contexts, contribute to the current socioeconomic landscapes of these states.
For a more in-depth understanding, further research incorporating additional variables such as healthcare access, employment rates, and urbanization levels would be beneficial.
I Love The Poorly Educated!
Donald Trump’s statement, “I love the poorly educated,” made during his 2016 campaign, underscores a notable correlation between educational attainment and political support in recent U.S. elections. Analysis of voting patterns reveals that white voters without college degrees have consistently shown strong support for Trump across the 2016, 2020, and 2024 elections. For instance, in 2024, Trump secured 66% of the vote among white voters without college degrees, compared to 32% among those with college degrees.
This trend reflects a broader realignment in American politics, where class and educational divides have become more pronounced. Historically, higher income was associated with Republican support, but recent elections have seen this correlation diminish, with educational attainment emerging as a more significant predictor of voting behavior. Notably, in 2024, Trump performed better among lower-income voters, marking a shift in the traditional income-based support patterns. (Wikipedia)
The emphasis on class over race in political identity has also become more evident. Trump’s ability to connect with working-class voters, particularly those without college degrees, has been attributed to his focus on economic concerns, such as addressing inflation and job security, resonating with individuals who feel left behind by globalization and technological advancements. (The Wall Street Journal)(The Australian)
In summary, Trump’s appeal to less-educated voters is reflected in voting patterns, with educational attainment serving as a significant factor in political alignment. This shift highlights the evolving dynamics of American politics, where class and education have become critical determinants of voter behavior.
The interplay between high poverty rates, low educational attainment, the historical Southern Strategy, and Donald Trump’s appeal to less-educated voters reveals complex socio-political dynamics in the United States.
1. High Poverty Rates and Low Educational Attainment: States with elevated poverty levels often exhibit lower rates of educational attainment. For instance, Mississippi and Louisiana have some of the highest poverty rates and among the lowest percentages of residents with bachelor’s degrees. This correlation suggests that limited educational opportunities can perpetuate economic hardships, creating cycles of poverty.
2. The Southern Strategy: In the latter half of the 20th century, the Republican Party implemented the Southern Strategy, aiming to attract white voters in the South by appealing to racial tensions and resistance to civil rights advancements. This approach led to a political realignment, with many Southern states shifting from Democratic to Republican allegiances. The strategy often exploited existing racial and economic anxieties, influencing voting behaviors and party loyalties in the region.
3. Trump’s Appeal to Less-Educated Voters: Donald Trump’s political campaigns have resonated notably with white voters lacking college degrees. In the 2024 election, Trump secured 66% of the vote among white voters without college degrees, compared to 45% among those with college degrees. This support base aligns with regions characterized by lower educational attainment and higher poverty rates, particularly in rural and Southern areas.
4. Interconnections: The convergence of these factors can be observed in several ways:
Economic and Educational Disparities: Regions with persistent poverty and limited educational resources may feel marginalized by broader economic shifts, making populist messages that promise to address their grievances more appealing.
Historical Political Strategies: The Southern Strategy’s emphasis on racial and cultural issues has had lasting impacts on political affiliations in the South, creating an environment where appeals to traditional values and economic frustrations resonate.
Contemporary Political Dynamics: Trump’s rhetoric often targets the concerns of working-class, less-educated voters, addressing issues like job losses, immigration, and national identity, which are particularly salient in regions affected by economic decline and educational disparities.
Conclusion: The correlation between high poverty, low educational attainment, the legacy of the Southern Strategy, and Trump’s support among less-educated voters underscores the intricate relationship between socio-economic conditions and political behavior. Addressing these challenges requires nuanced policies that enhance educational opportunities, economic development, and social cohesion to bridge the divides influencing contemporary American politics.
Policies That Better Serve High-Poverty, Low-Education States
To break cycles of poverty and increase economic mobility, policies must address education, economic opportunities, healthcare, and infrastructure. Here are key policy solutions that have been shown to improve conditions in high-poverty, low-education regions:
1. Education Reform & Workforce Development
Why? Higher education levels correlate with lower poverty rates, higher wages, and better job opportunities.
✅ Universal Pre-K & Early Childhood Education
Expanding Head Start and state-funded Pre-K programs
Improves literacy, cognitive skills, and long-term earnings
✅ Tuition-Free or Reduced-Cost Community College & Trade Schools
Programs like Tennessee’s “Tennessee Promise” provide free 2-year college
Apprenticeships & vocational training in high-demand industries (manufacturing, healthcare, renewable energy, tech)
✅ Investing in Rural Schools & Teacher Pay
States like Mississippi and West Virginia suffer from underfunded schools and teacher shortages
Raising teacher salaries and school funding leads to better student performance
✅ Student Loan Forgiveness for Public Service in High-Poverty Areas
Incentivize teachers, nurses, and social workers to work in underserved rural communities
2. Economic & Job Growth Policies
Why? Many high-poverty states suffer from low wages, lack of job opportunities, and reliance on declining industries (coal, agriculture).
✅ Raise the Minimum Wage & Strengthen Workers’ Rights
Many of the highest poverty states still follow the $7.25 federal minimum wage
Raising wages increases local economic activity and reduces reliance on welfare
✅ Invest in Infrastructure & Broadband Internet Expansion
Rural communities need better roads, public transit, and high-speed internet
Broadband access helps businesses, education, and telehealth services
✅ Incentivize Small Business Growth & Local Manufacturing
Tax incentives and grants for small businesses, especially in rural and minority communities
Rebuilding domestic manufacturing jobs through public-private partnerships
✅ Expand Job Retraining Programs for Displaced Workers
Many rural areas have lost coal, steel, and textile jobs
Retraining programs in clean energy, logistics, and healthcare help workers transition
3. Healthcare & Social Safety Nets
Why? Poor health prevents economic mobility — people can’t work if they’re sick.
✅ Expand Medicaid in All States
Mississippi, Alabama, and other high-poverty states have refused Medicaid expansion
Expanding Medicaid improves preventative care, reduces hospital closures, and lowers medical debt
✅ Increase Mental Health & Addiction Treatment Access
The opioid crisis has devastated high-poverty states like West Virginia and Kentucky
More funding for rehab programs, mental health clinics, and crisis intervention services
✅ Strengthen Food Security Programs (SNAP, WIC, School Meals)
Childhood hunger impacts cognitive development and education outcomes
Expanding free school meals and food assistance programs helps break poverty cycles
4. Tax & Economic Policy Reform
Why? Many high-poverty states have regressive tax systems that overburden low-income residents while providing tax breaks to corporations.
✅ End Regressive Tax Policies & Increase Tax Credits for Low-Income Families
Some states rely on high sales taxes instead of progressive income taxes
Expanding Earned Income Tax Credit (EITC) and Child Tax Credits lifts millions out of poverty
✅ Ensure Federal Infrastructure & Rural Investment Funding Goes to Underserved Areas
Southern states have received federal infrastructure grants but often misallocate funds
More oversight & transparency ensures money benefits schools, roads, and public services
Conclusion: What Works Best?
Education access & workforce training → Long-term poverty reduction
Job creation & infrastructure investment → Immediate economic improvement
Healthcare & social safety nets → Reduces health-related poverty traps
Progressive tax & economic policies → Supports working-class families
By implementing these targeted policies, high-poverty, low-education states can build stronger economies and improve quality of life for their residents. Would you like me to analyze how a specific state could apply these policies effectively?
Policy Comparison Table
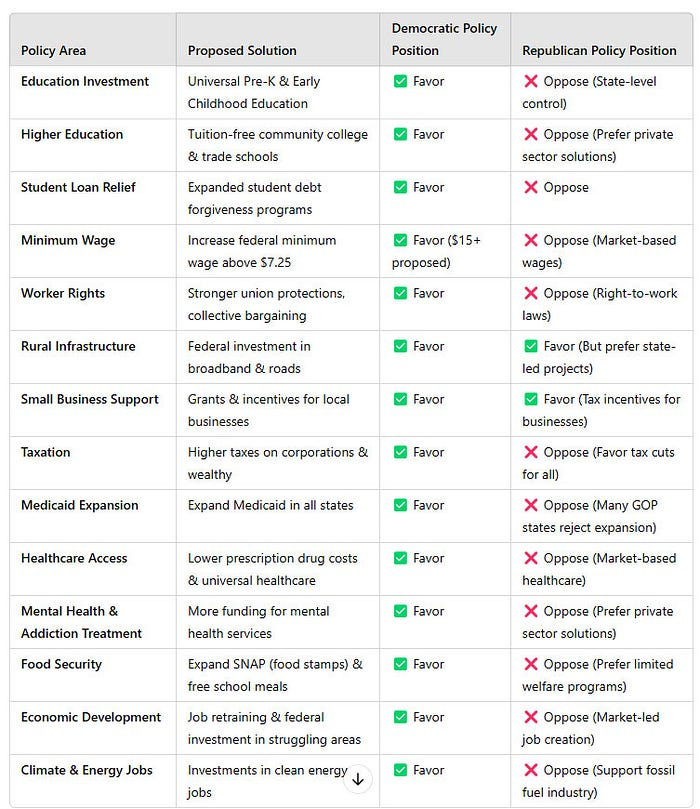
A table outlining Democratic vs. Republican policies on these issues reveals that Democratic policies generally favor government investment in education, healthcare, worker protections, and social programs, whereas Republican policies prioritize tax cuts, deregulation, and market-based solutions. While both parties support rural infrastructure and small business incentives, Republicans tend to prefer state-level control rather than federal programs.
Here is a policy comparison table that shows whether Democratic or Republican policies generally favor solutions for high-poverty, low-education states:
Summary:
Democratic policies generally favor government investment in education, healthcare, worker protections, and social programs to reduce poverty.
Republican policies generally favor low taxes, deregulation, and market-based solutions, but often oppose large-scale government programs.
Both support rural infrastructure and small business incentives, though Republicans prefer state-level control rather than federal programs.
State-By-State Analysis of which policies could be most effective?
Addressing high poverty and low educational attainment requires tailored policies that consider each state’s unique socio-economic landscape. Below is a state-by-state analysis highlighting specific challenges and policy recommendations:
1. Mississippi
Challenges: Highest poverty rate in the U.S.; low educational attainment; underfunded schools.
Recommendations:
Increase Education Funding: Implement equitable funding formulas to ensure resources reach high-poverty schools.
Expand Early Childhood Education: Invest in universal pre-K programs to improve school readiness.
Workforce Development: Enhance vocational training aligned with local job markets.
2. Louisiana
Challenges: High poverty and unemployment rates; educational disparities; healthcare access issues.
Recommendations:
Medicaid Expansion: Improve healthcare access to support a healthier workforce.
School Improvement Grants: Target funding to low-performing schools for infrastructure and curriculum enhancements.
Economic Diversification: Promote industries beyond oil and gas to create varied employment opportunities.
3. New Mexico
Challenges: Elevated poverty levels; significant Native American population facing unique educational barriers.Associated Press
Recommendations:
Culturally Relevant Curriculum: Develop educational programs that respect and integrate Native cultures.
Teacher Incentives: Offer bonuses and housing assistance to attract educators to rural areas.
Healthcare Services in Schools: Provide on-site health clinics to address student wellness.
4. Kentucky
Challenges: High poverty, particularly in Appalachian regions; declining coal industry affecting employment.
Recommendations:
Economic Transition Programs: Support retraining for former coal workers in renewable energy sectors.
Infrastructure Investment: Improve transportation to connect isolated communities to job centers.
Substance Abuse Programs: Expand addiction treatment and prevention initiatives.
5. Arkansas
Challenges: Rural poverty; educational attainment below national average; limited access to technology.
Recommendations:
Broadband Expansion: Invest in internet infrastructure to support education and business.
Adult Education: Provide GED and continuing education programs to boost employment prospects.
Agricultural Support: Enhance support for small farmers to stabilize rural economies.
6. West Virginia
Challenges: Economic decline due to reduced coal mining; high opioid addiction rates; aging population.
Recommendations:
Diversify Economy: Invest in tourism and technology sectors to create new jobs.
Healthcare Expansion: Increase funding for mental health and addiction services.
Youth Retention Programs: Develop initiatives to keep young talent in the state.
7. Alabama
Challenges: High poverty in Black Belt region; disparities in educational funding; healthcare access issues.
Recommendations:
Equitable School Funding: Adjust funding formulas to ensure all districts receive adequate resources.Wikipedia
Rural Healthcare Initiatives: Expand clinics and telemedicine services in underserved areas.
Civil Rights Tourism: Leverage historical sites to boost local economies.
8. Oklahoma
Challenges: Poverty in Native American communities; underfunded public schools; high uninsured rates.
Recommendations:
Partnerships with Tribes: Collaborate on education and health programs respecting tribal sovereignty.
Increase Teacher Pay: Attract and retain quality educators through competitive salaries.
Medicaid Expansion: Improve access to healthcare for low-income residents.
9. Tennessee
Challenges: Urban-rural divide in education quality; healthcare access; opioid crisis.
Recommendations:
Community Schools: Integrate services like healthcare and after-school programs within schools.
Job Training Programs: Align training with industries such as automotive and healthcare.
Substance Abuse Education: Implement comprehensive prevention programs in schools.
10. South Carolina
Challenges: High poverty in rural areas; racial disparities in education; limited public transportation.
Recommendations:
Early Childhood Programs: Expand access to pre-K to improve long-term educational outcomes.
Public Transit Development: Improve transportation to connect residents to employment hubs.
Health Education: Increase programs focusing on nutrition and preventive care.
Implementing these targeted policies requires collaboration between federal, state, and local governments, as well as community organizations, to effectively address the unique challenges faced by each state.
Below is a table listing the U.S. Senators and Representatives from the states with the highest poverty rates, many of which were historically targeted by the Southern Strategy. The poverty rates are based on data from the U.S. Census Bureau’s American Community Survey (2016–2020). (Wikipedia)
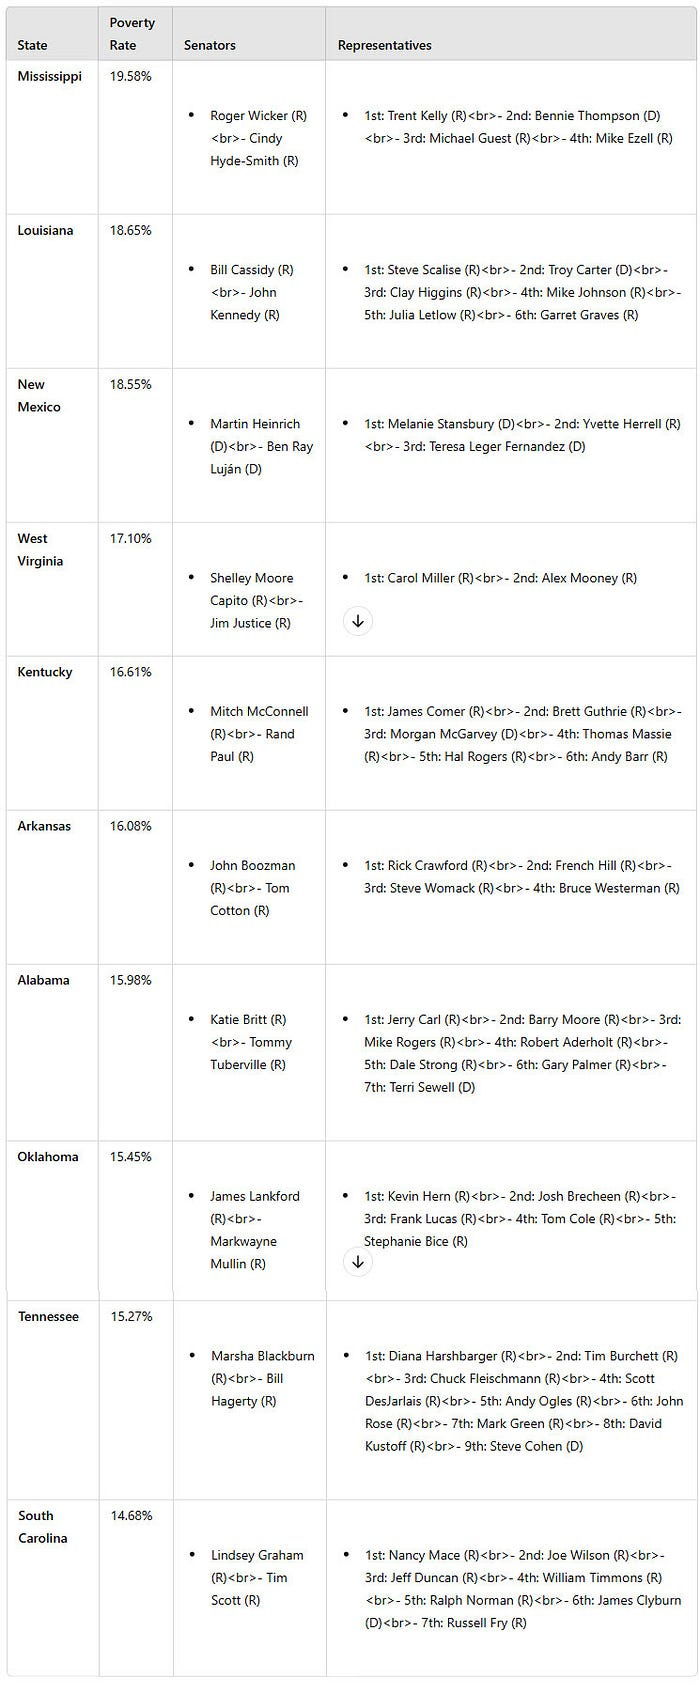
Note: The political affiliations (Republican — R, Democrat — D) are based on the current 119th United States Congress. (Wikipedia)
These states, characterized by high poverty rates, have diverse political representations, with a mix of Republican and Democratic members in both the Senate and the House of Representatives.
